By DiVoMiner Team
The internet’s rapid growth has led to an explosive increase in data volume and complexity. Traditional analytical methods struggle with evaluating extensive data, leading researchers to spend significant time sifting through it. They need a data analysis platform to extract valuable insights and draw compelling conclusions from these massive data sets.
What are the benefits of a data analysis platform? With such a platform, people can quickly and easily analyze large amounts of data and reach conclusions, whether for academic research, business decisions, or personal interests. Its strong functionality can aid in discerning whether the data indicates growth or decline trends, allowing the data to articulate compelling truths. This exemplifies the power of data analysis platform.
Indeed, while it may sound overly profound, the reality is that numerous industries and scenarios can leverage data analysis platforms to streamline work processes, thereby enhancing efficiency. This can be observed in various realms, including comparisons of sales figures, financial data, market shares, product performance, individual skill assessments, regional population statistics, sentiment analysis, research findings analysis, and an array of other scenarios.
There is a platform that serves as an all-in-one tool for content analysis and data mining. It integrates and addresses the demands of quantitative (content analysis), computational (algorithms), and intelligent (large language models) research methods. By using AI-aided content analysis, it begins with the structuralization of big data, pulling together online and offline data, and utilizing methods such as web mining, semantic network analysis, and machine deep learning to automate the discovery of unknown patterns, thereby initiating an initial exploration of the data landscape.
This platform is called DiVoMiner. Users can access all the functionalities through a web browser without the need to install any software. This allows for convenient use of the platform’s features while saving time and costs and enhancing efficiency.
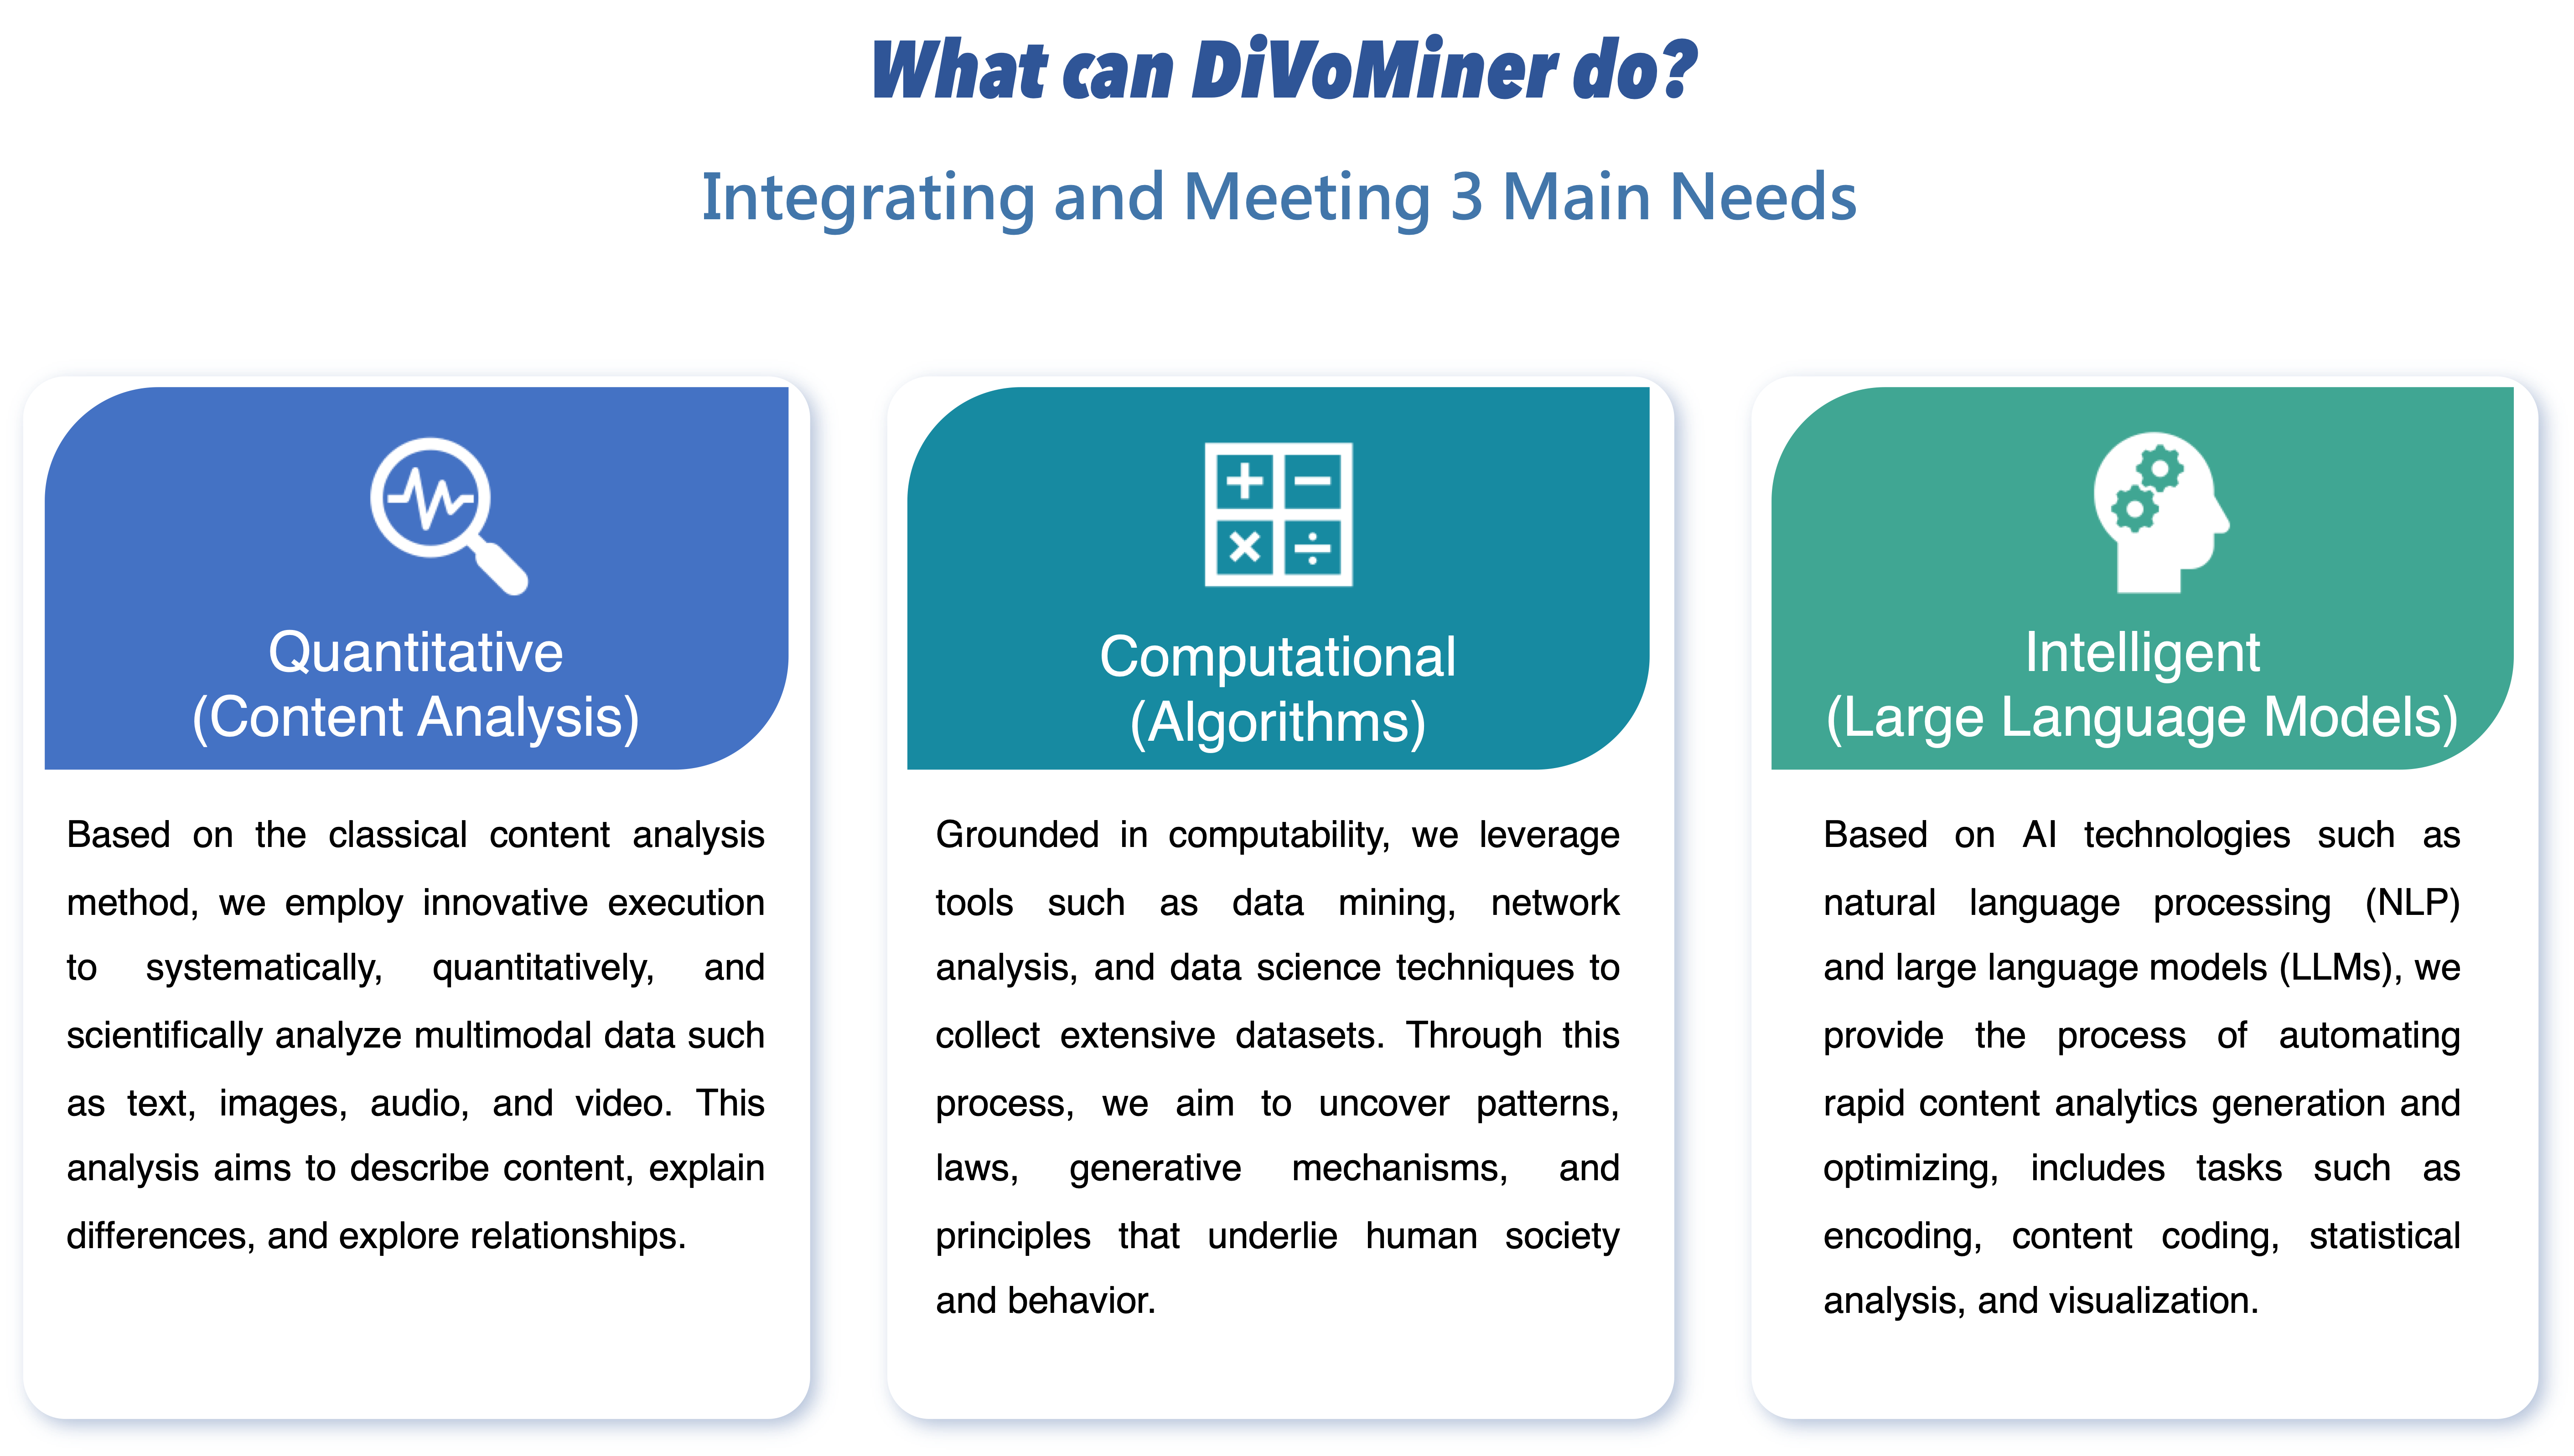
Now, let’s review the highlights of the DiVoMiner platform, mainly focusing on the various statistical analysis tasks that the DiVoMiner platform can accomplish.
What types of charts can be created on DiVoMiner?
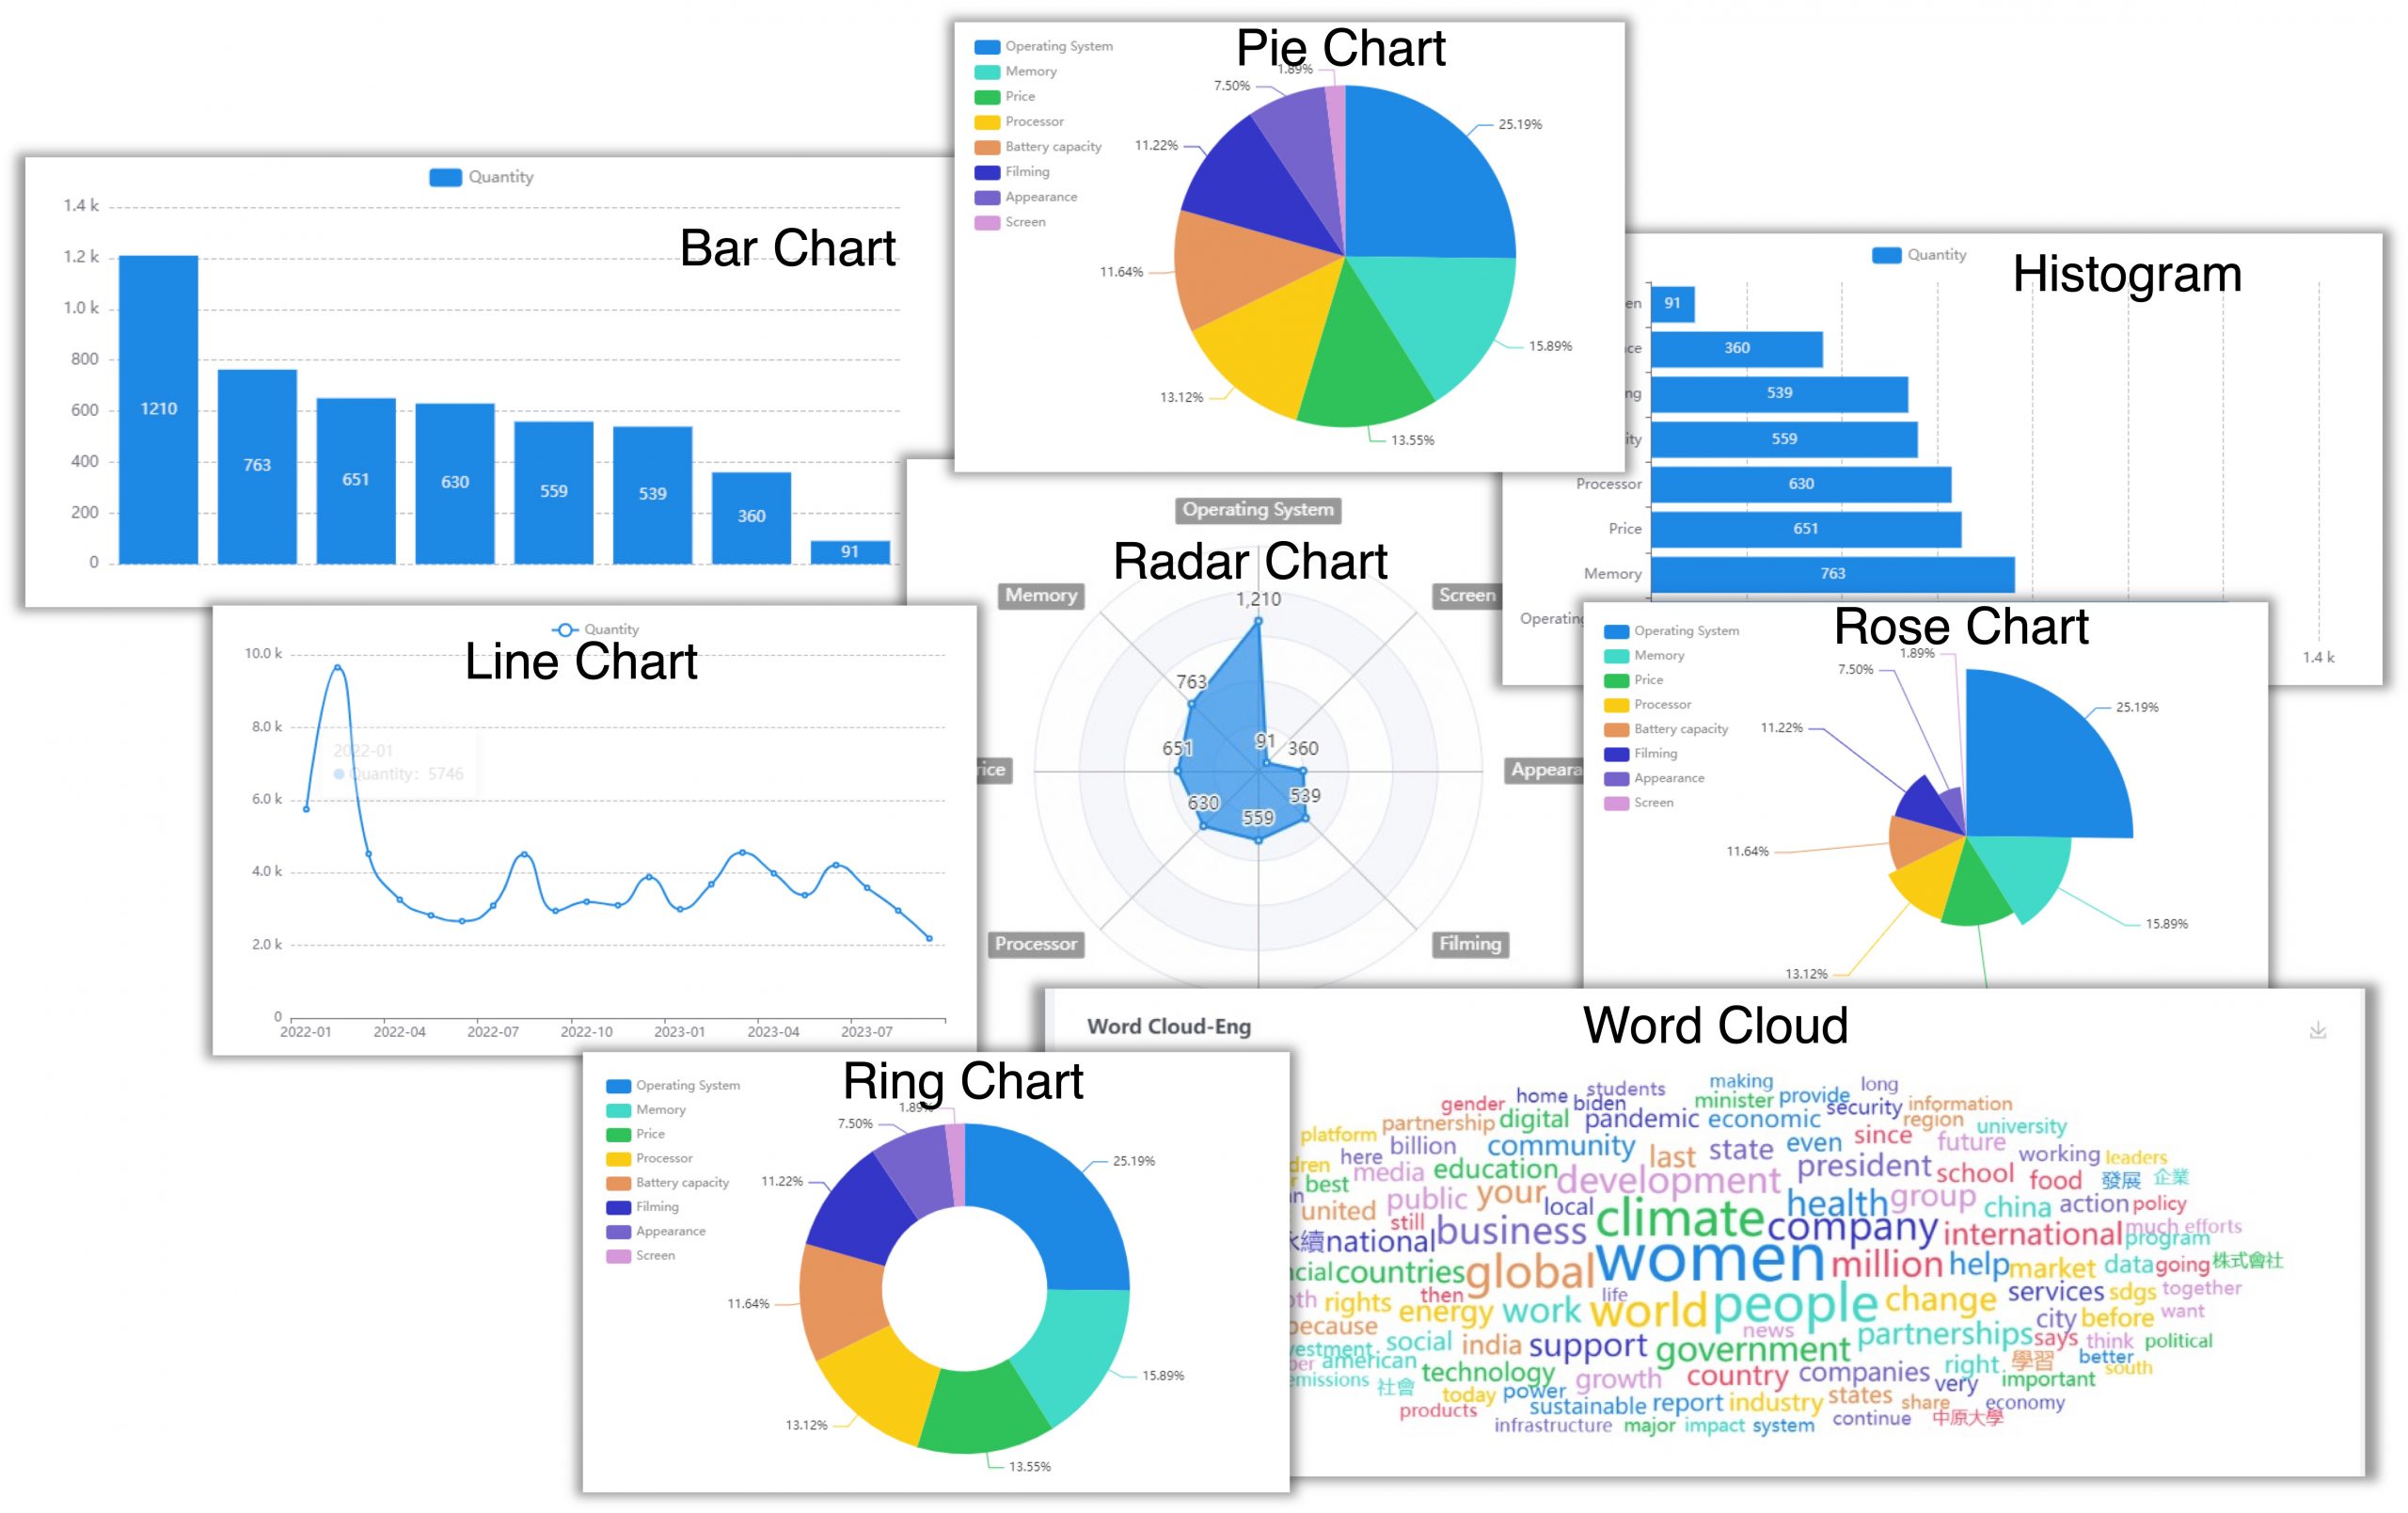
The DiVoMiner platform can generate various charts, such as single-variable analysis, multivariate analyses such as chi-square, correlation and regression.
Univariate descriptive statistics includes pie charts, word clouds, bar charts, radar charts, etc. The generation process of a word cloud begins with tokenizing the text, then analyzing the frequency of words in a text and presenting the size of the font based on the frequency.
Based on the requirements, variable charts can be generated on the platform to visually convey the meaning of the data, such as pie charts and bar charts.
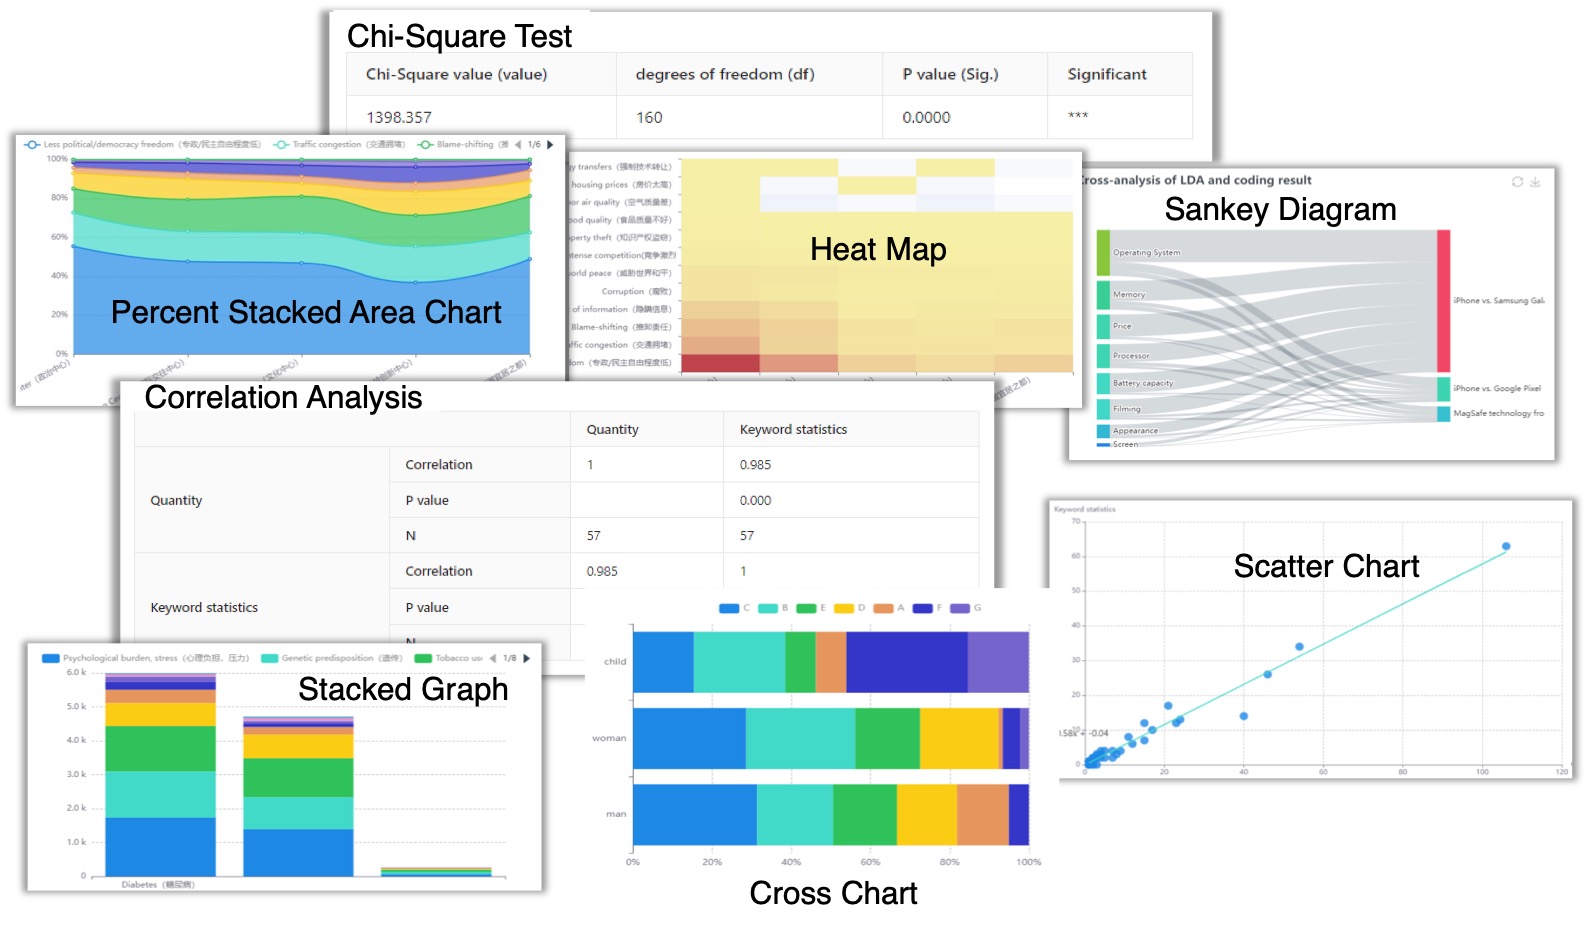
Multivariate analysis uses multiple variables for cross-analysis, including Sankey diagram, cross chart, stacked graph, chi-square test, correlation analysis, and regression analysis.
DiVoMiner provides automated algorithmic models. The sentiment analysis function is divided into analyzation of sentiments (positive and negative) and emotions (such as happiness and sadness). K-Means and LDA topic model are different algorithms, but the results of both are relatively similar. Furthermore, semantic network analysis and word cloud generation are largely similar in process, both involving the tokenization of the text and calculation of keyword frequencies. The distinction lies in semantic network analysis incorporating an additional layer by examining the associations between words.
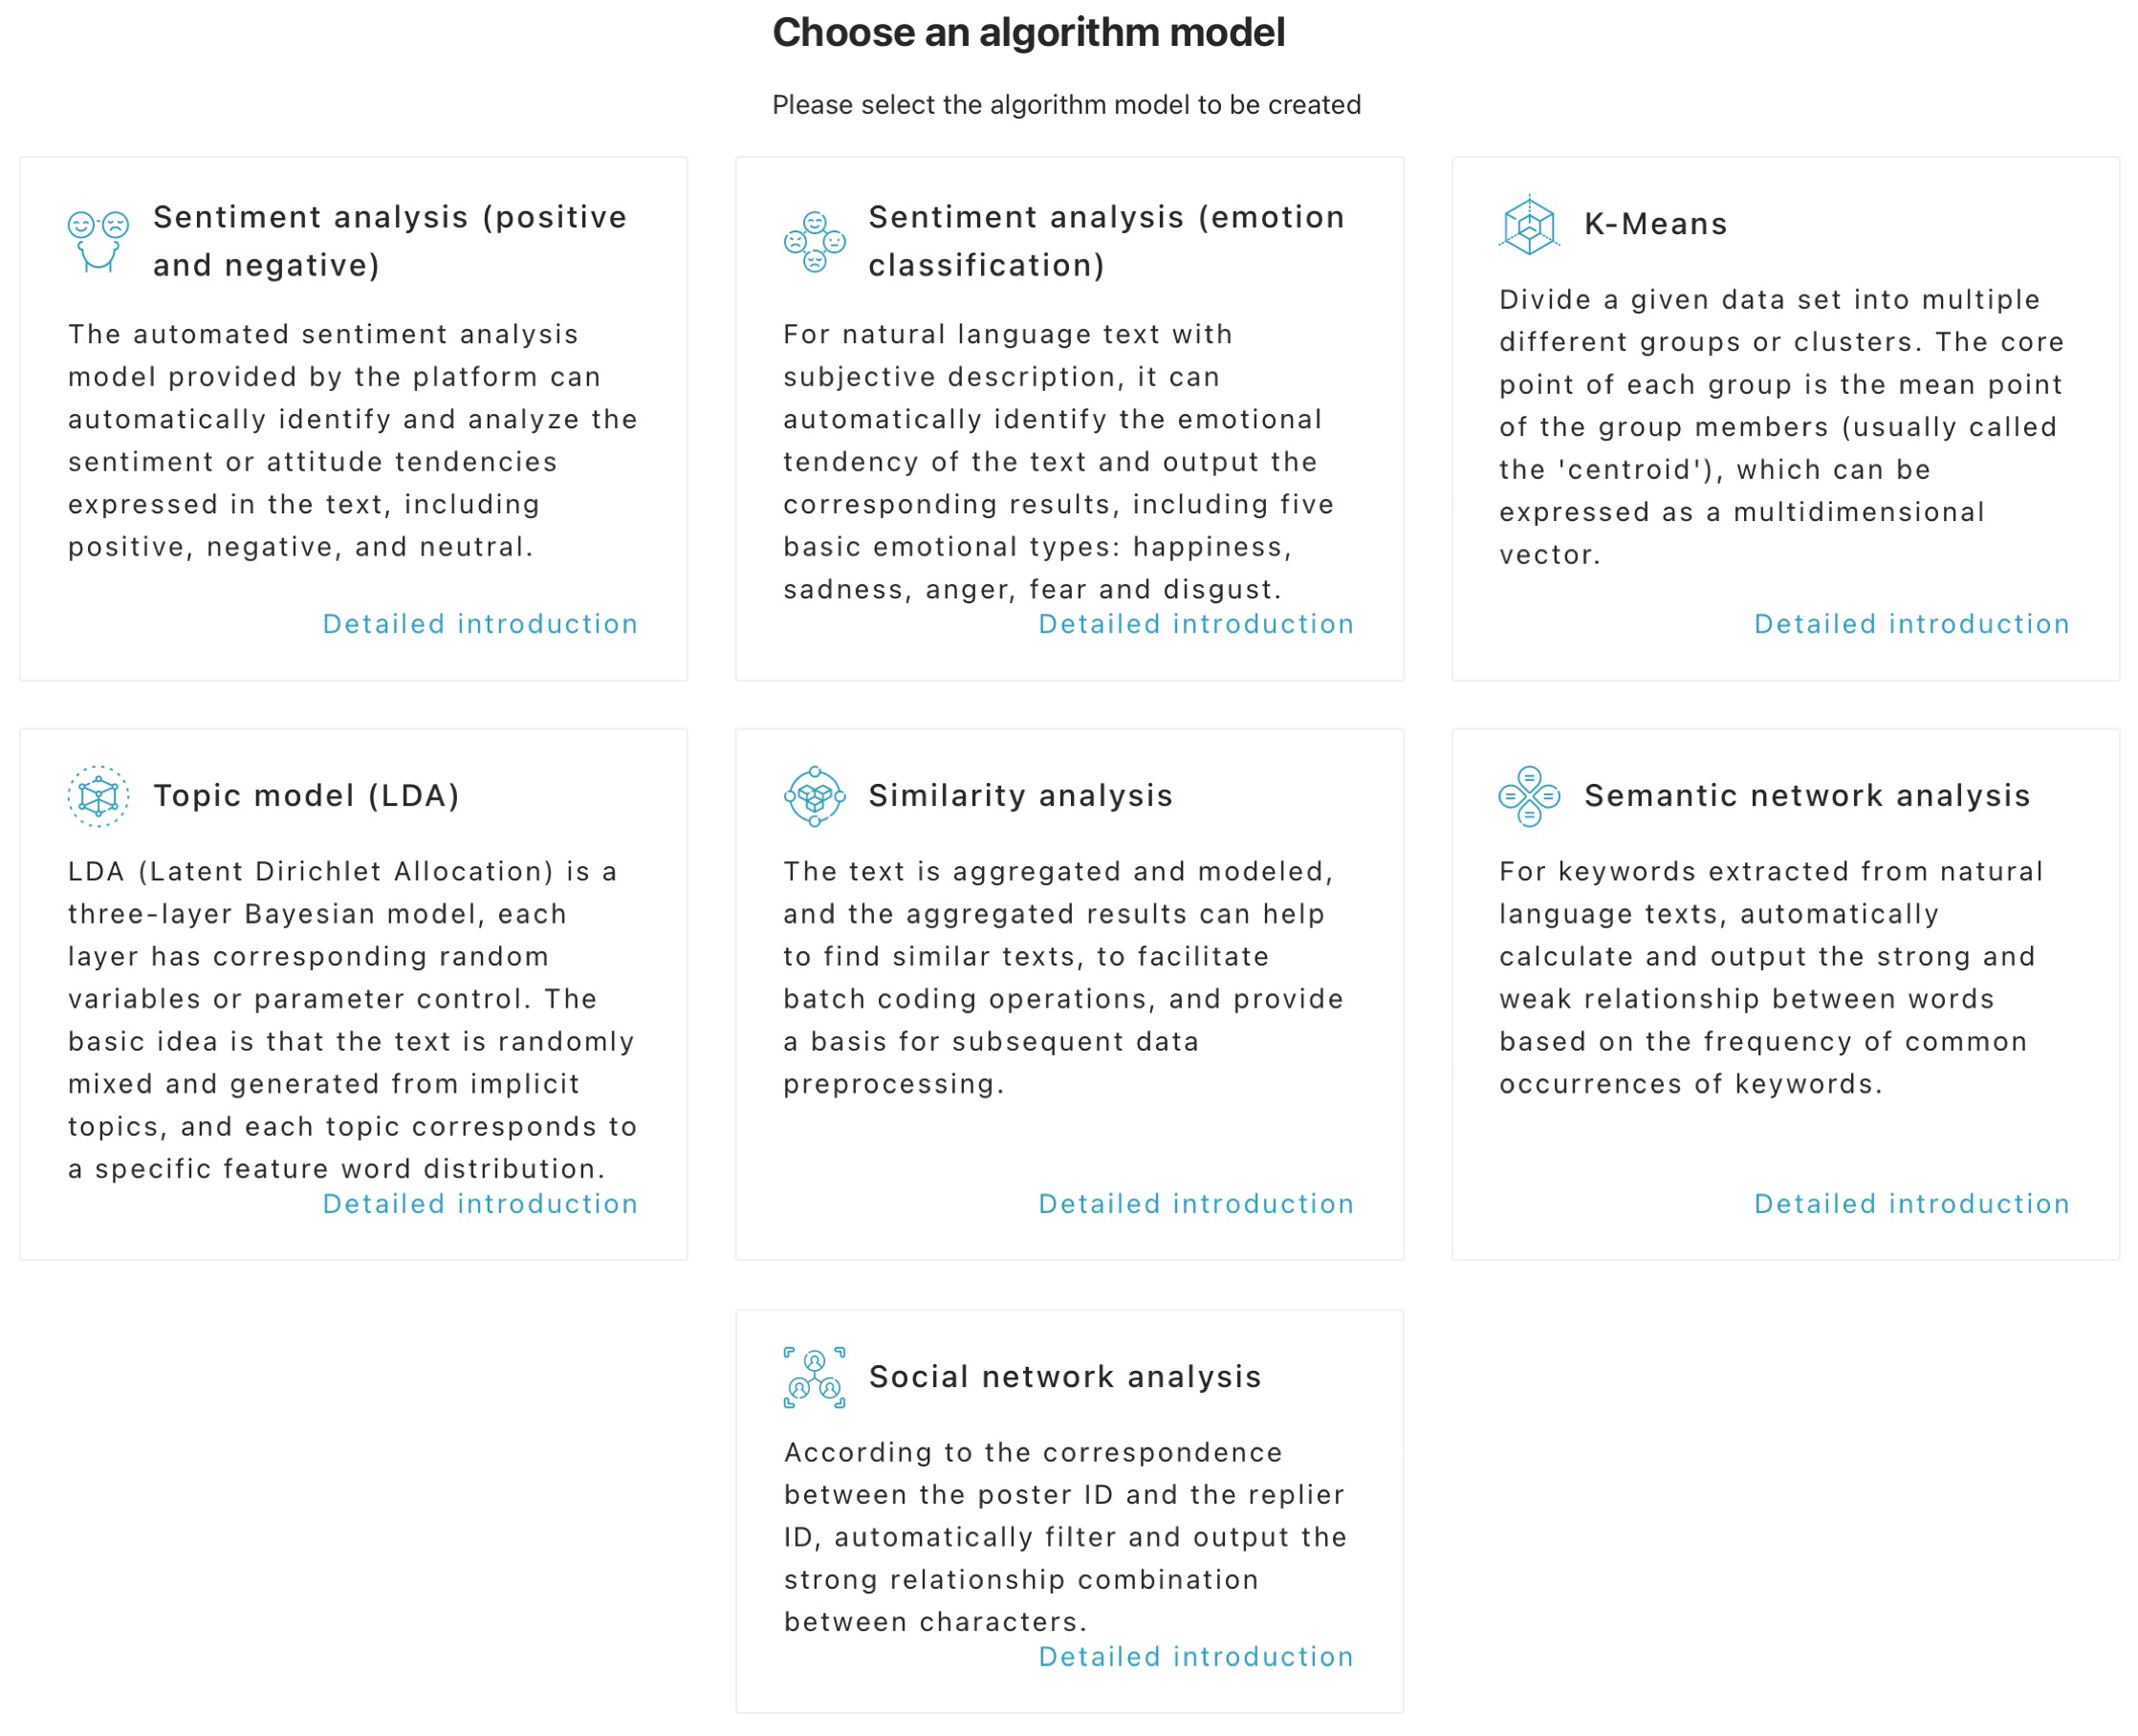
The true strength of DiVoMiner lies not only in its rich data analysis capabilities and numerous models, but also in its ability to flexibly integrate all variables for analysis, including uploaded fields, encoded results, and automatic generated algorithm results.
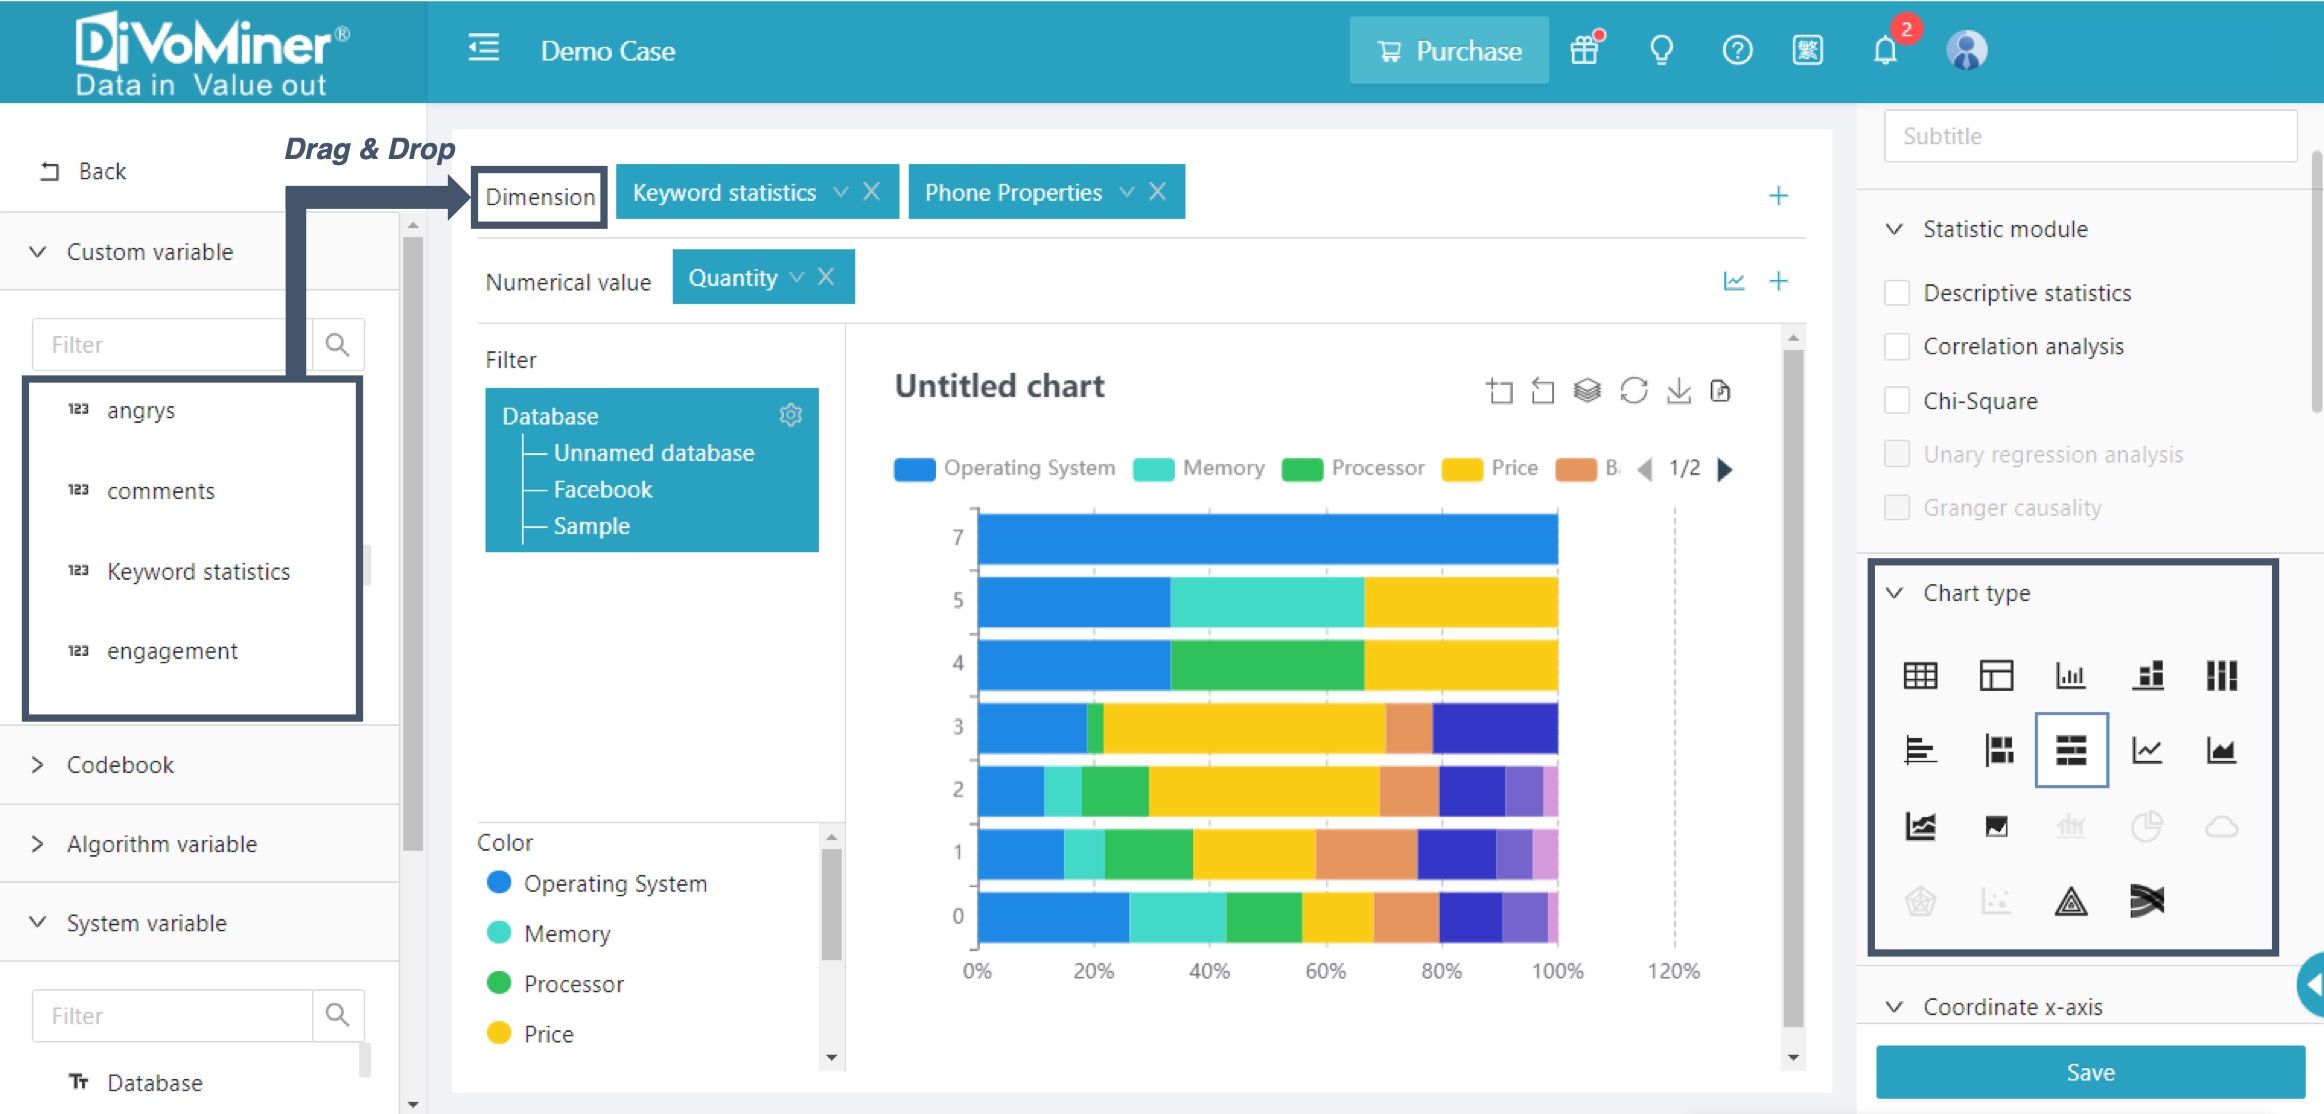
Some charts feature a small blue tag in the upper right corner, which is the multivariate analysis function. Clicking on it will lead you to the [Statistical Analysis] page, where you can view various contents including custom variables, codebook, system variables, and algorithmic variables. Simply drag and drop the variables for analysis onto the dimensions and select the desired chart type on the right to create a chart.
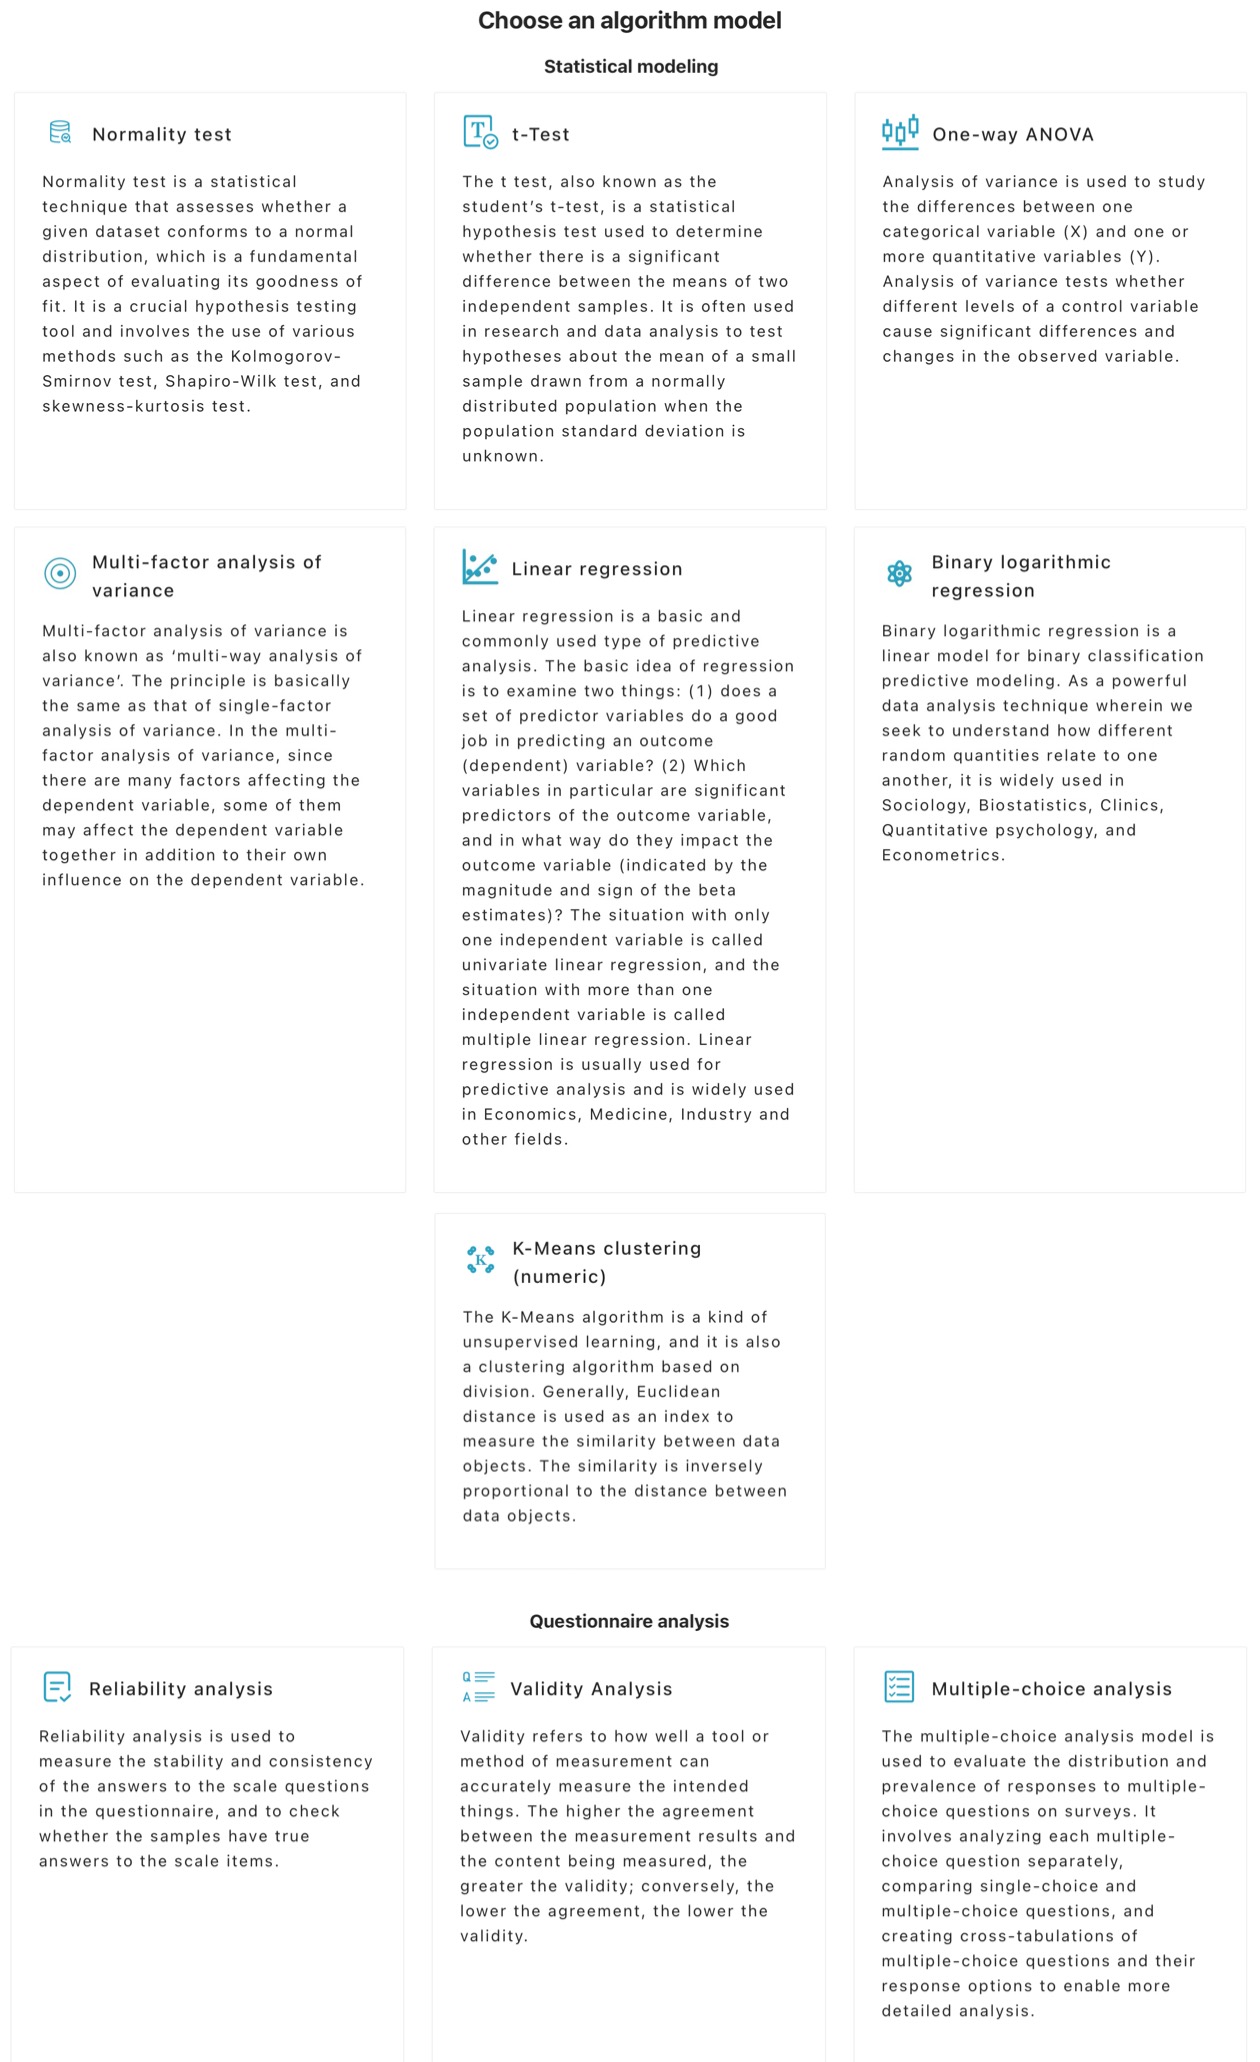
Exciting Update: Introducing a Variety of Quantitative Statistical Methods
In the field of statistical analysis, the DiVoMiner platform has introduced a variety of new quantitative statistical methods, including normality test, t-test, one-way ANOVA, multi-factor analysis of variance, linear regression, binary logistic regression, K-Means clustering (numeric), reliability analysis, validity analysis, and analysis of multiple-choice.
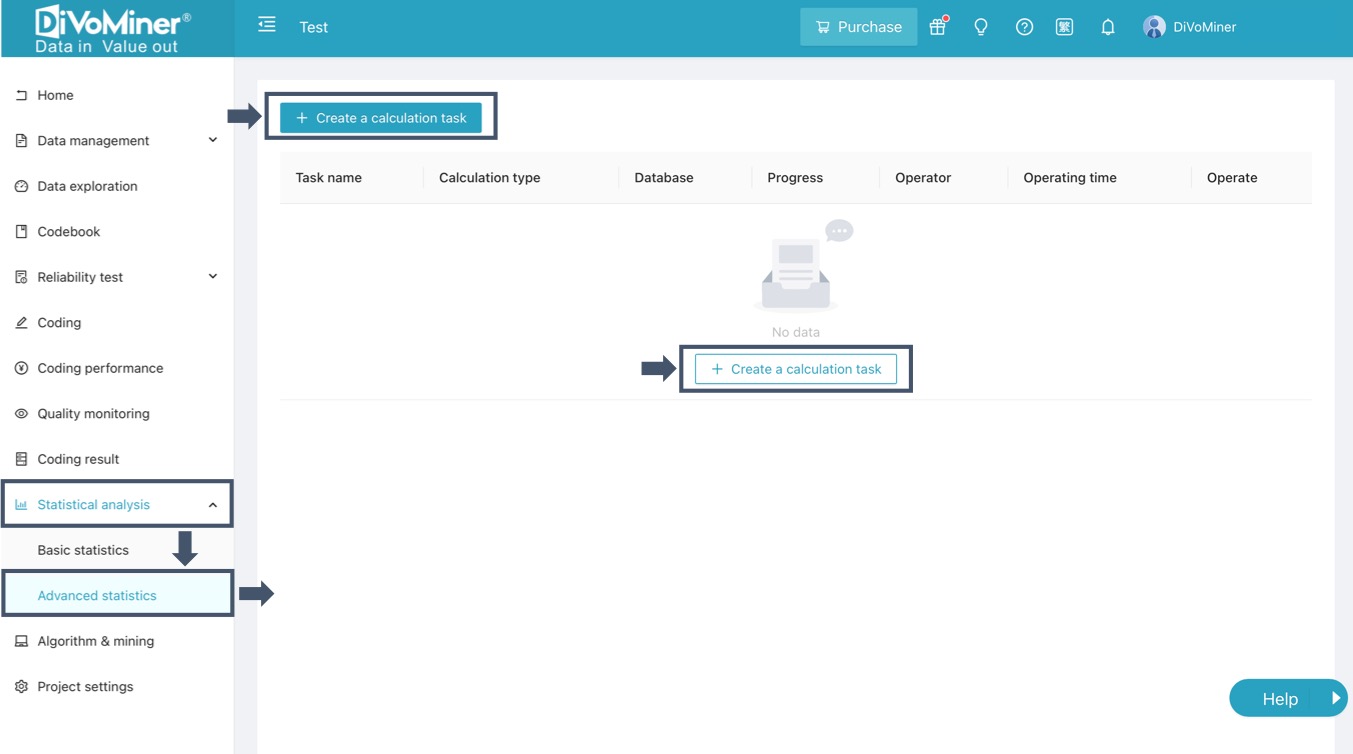
To use these features, simply log in to the DiVoMiner platform and go to [Advanced Analysis] in the [Statistical Analysis] section, click on [Create a calculation task] and choose the algorithm model that works best for you.
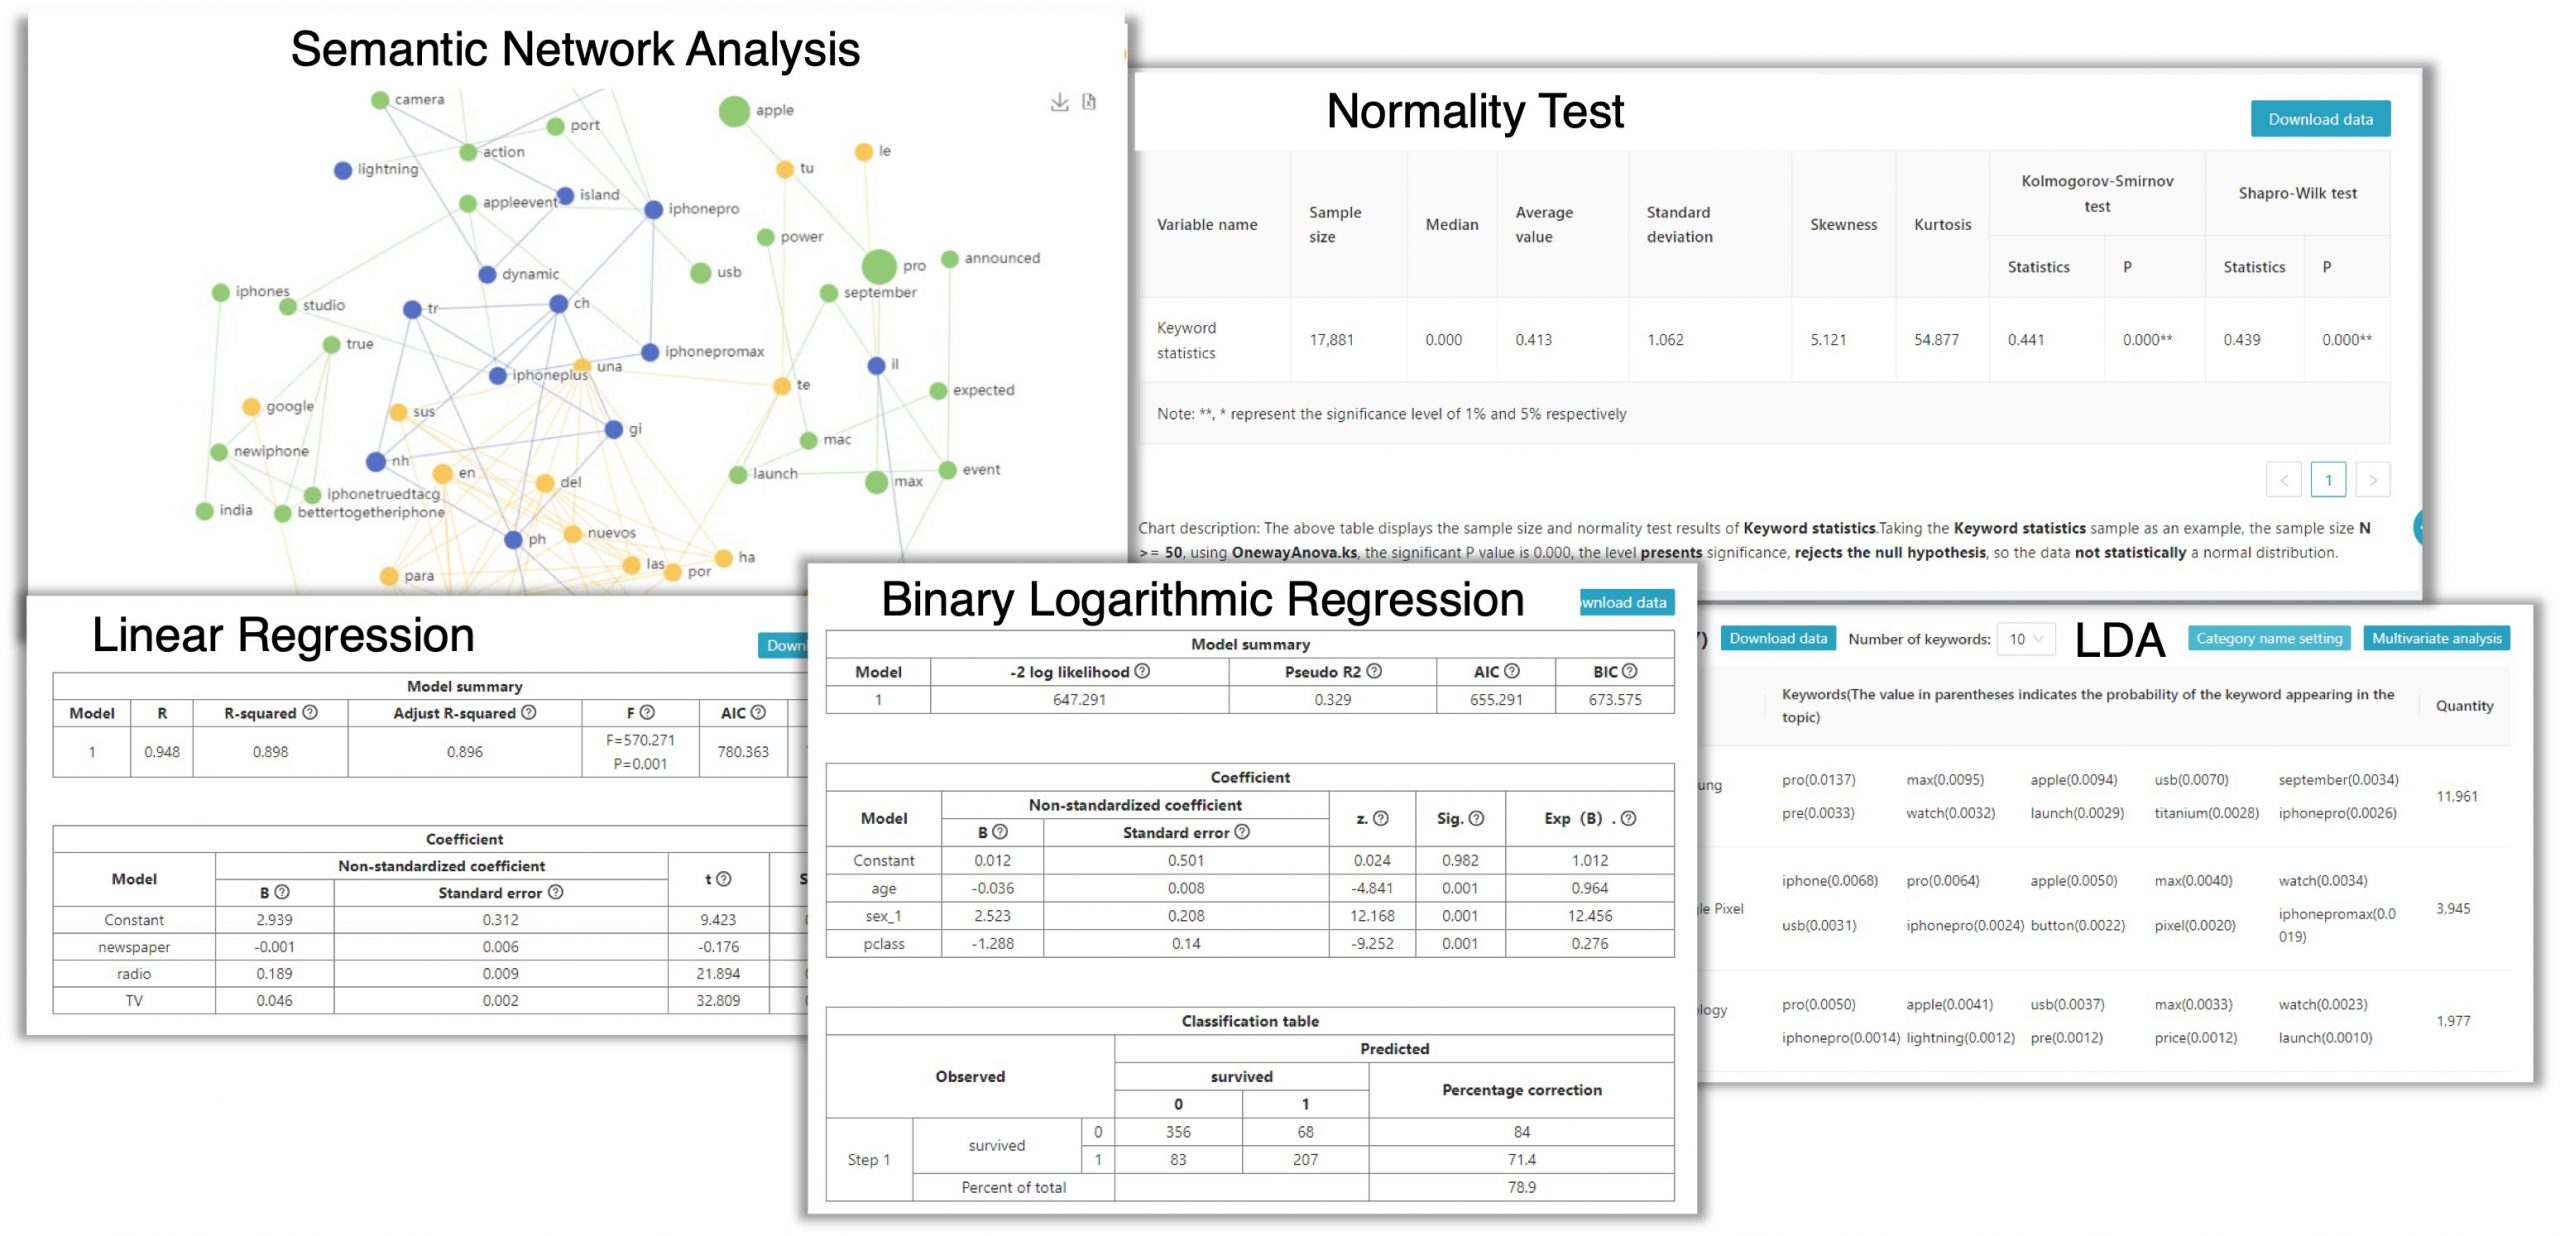
At DiVoMiner, we are dedicated to providing users with a variety of tools that empower you to take control of your data and explore its full potential. Our commitment is to fully understand users’ needs, enabling thorough exploration and deep analysis based on your specific requirements. This ensures that you can flexibly utilize data in academic writing, market research, financial analysis, and product performance evaluation, among other fields.
You can explore and utilize these wide range of essential tools in the platform for free. To get started, visit www.divominer.com.
